Case Study: The Generational Power Index
Each generation is shaped by its own unique historical context and cultural experiences, creating a shared perspective about the world that is different from their elders.
Therefore, its shouldn’t surprise us when any given generation takes the opportunity to shape the society around them, bending both political and economic structures to align with their values.
In the inaugural edition of our Generational Power Index (GPI), we aim to accurately break down the landscape of generational power in the current moment.
—On the Visual Capitalist Generational Power Index


ROLE: Creative Direction, Illustration, Data Visualization
TEAM: 3 designers (Rosey Eason, Jennifer West, Melissa Haavisto), 10 writers, 2 marketers
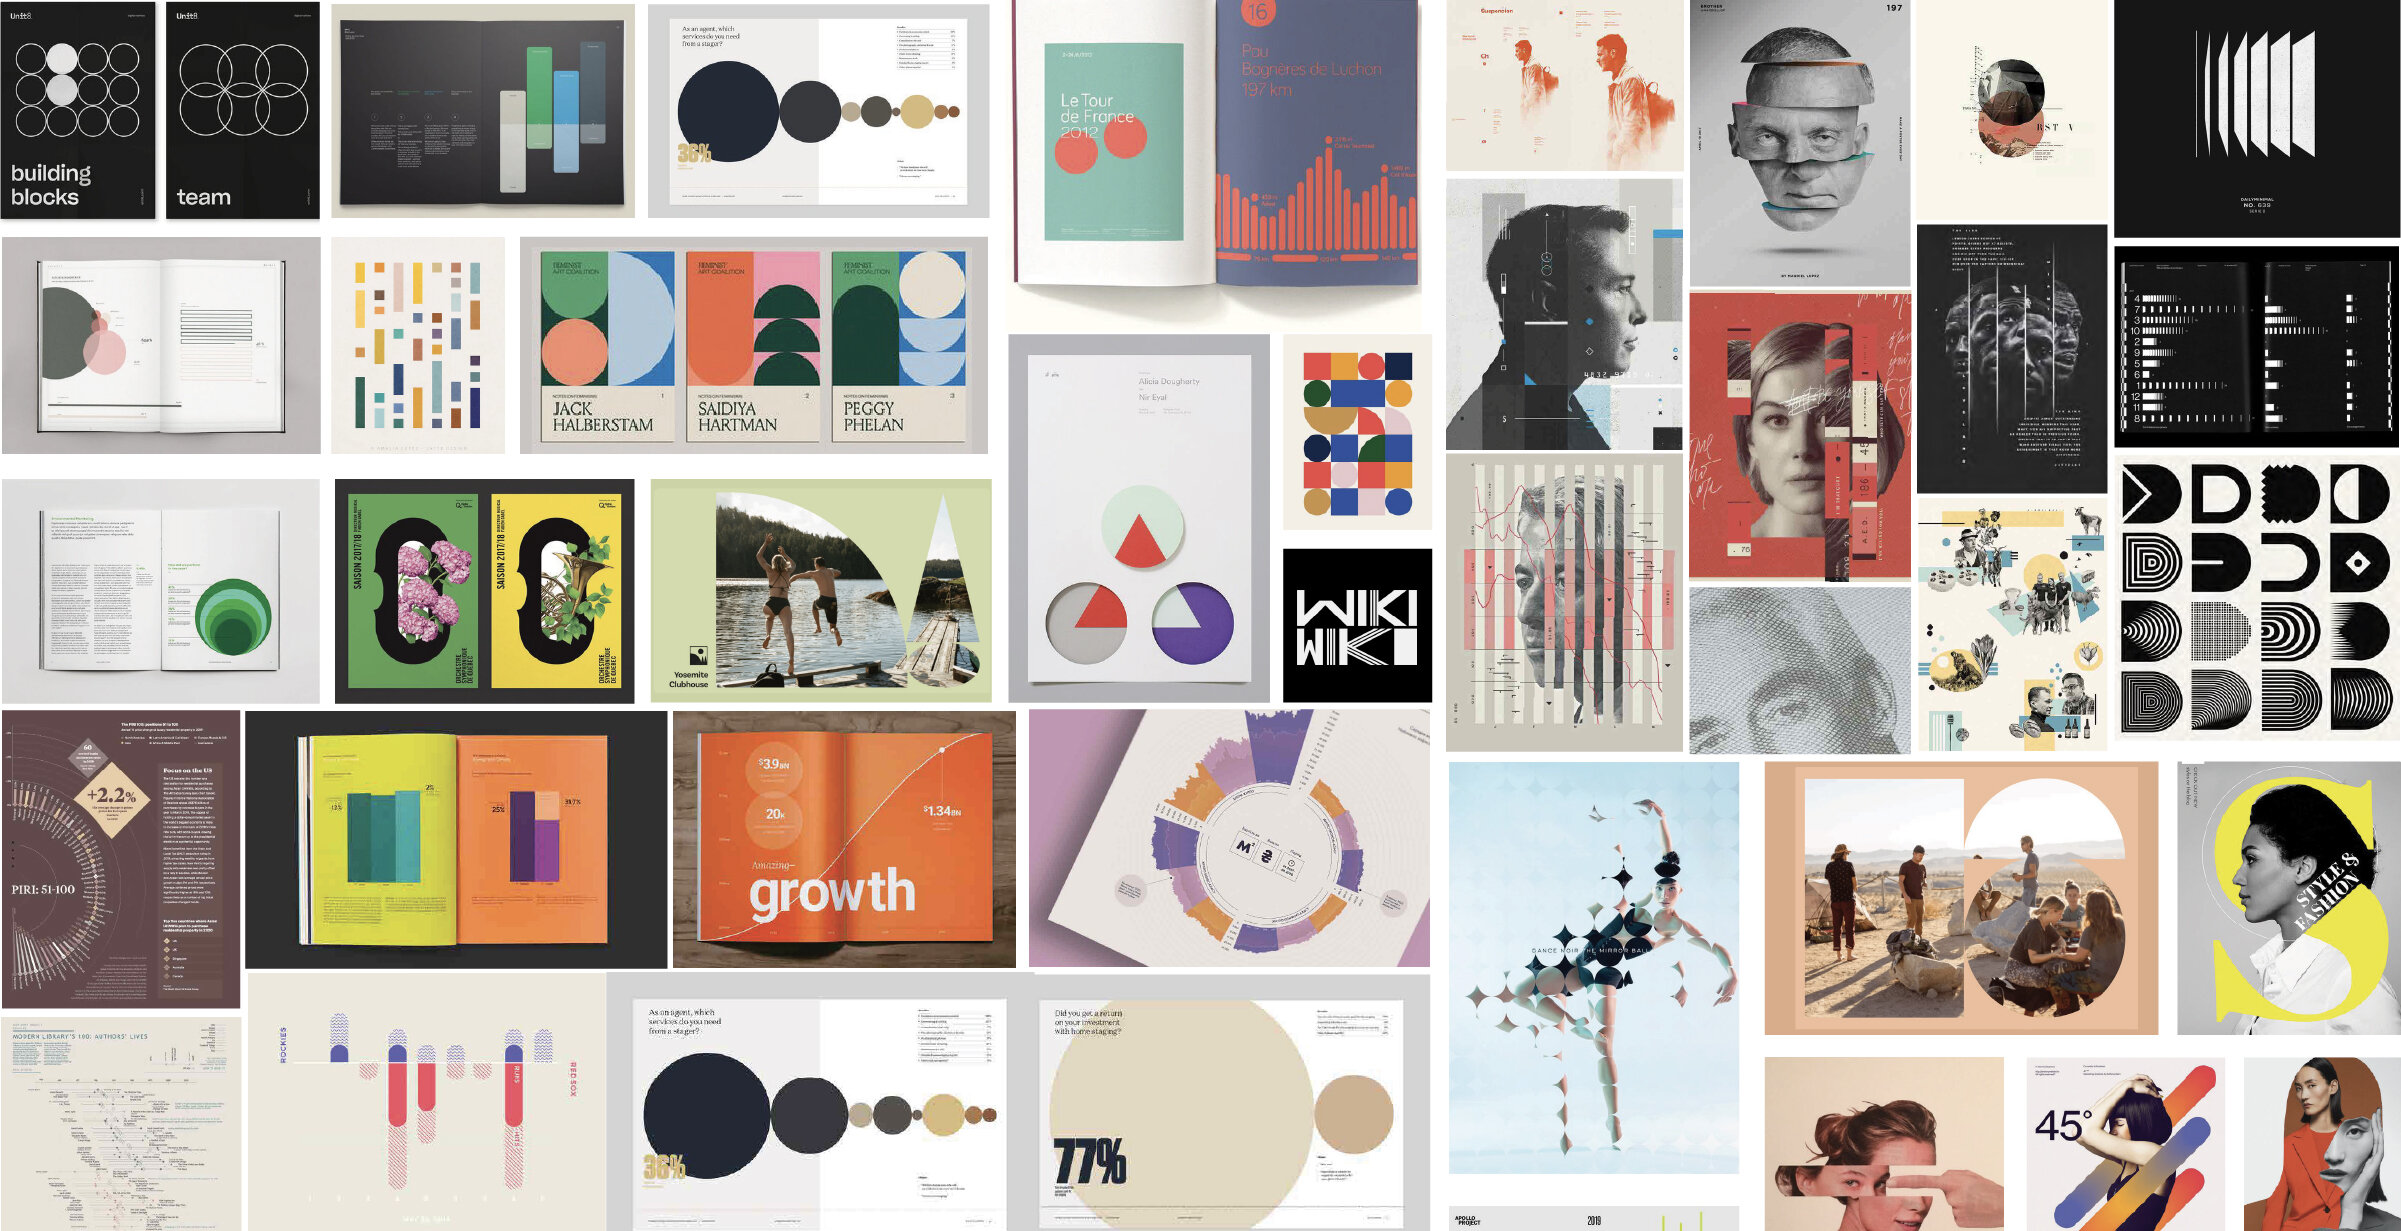
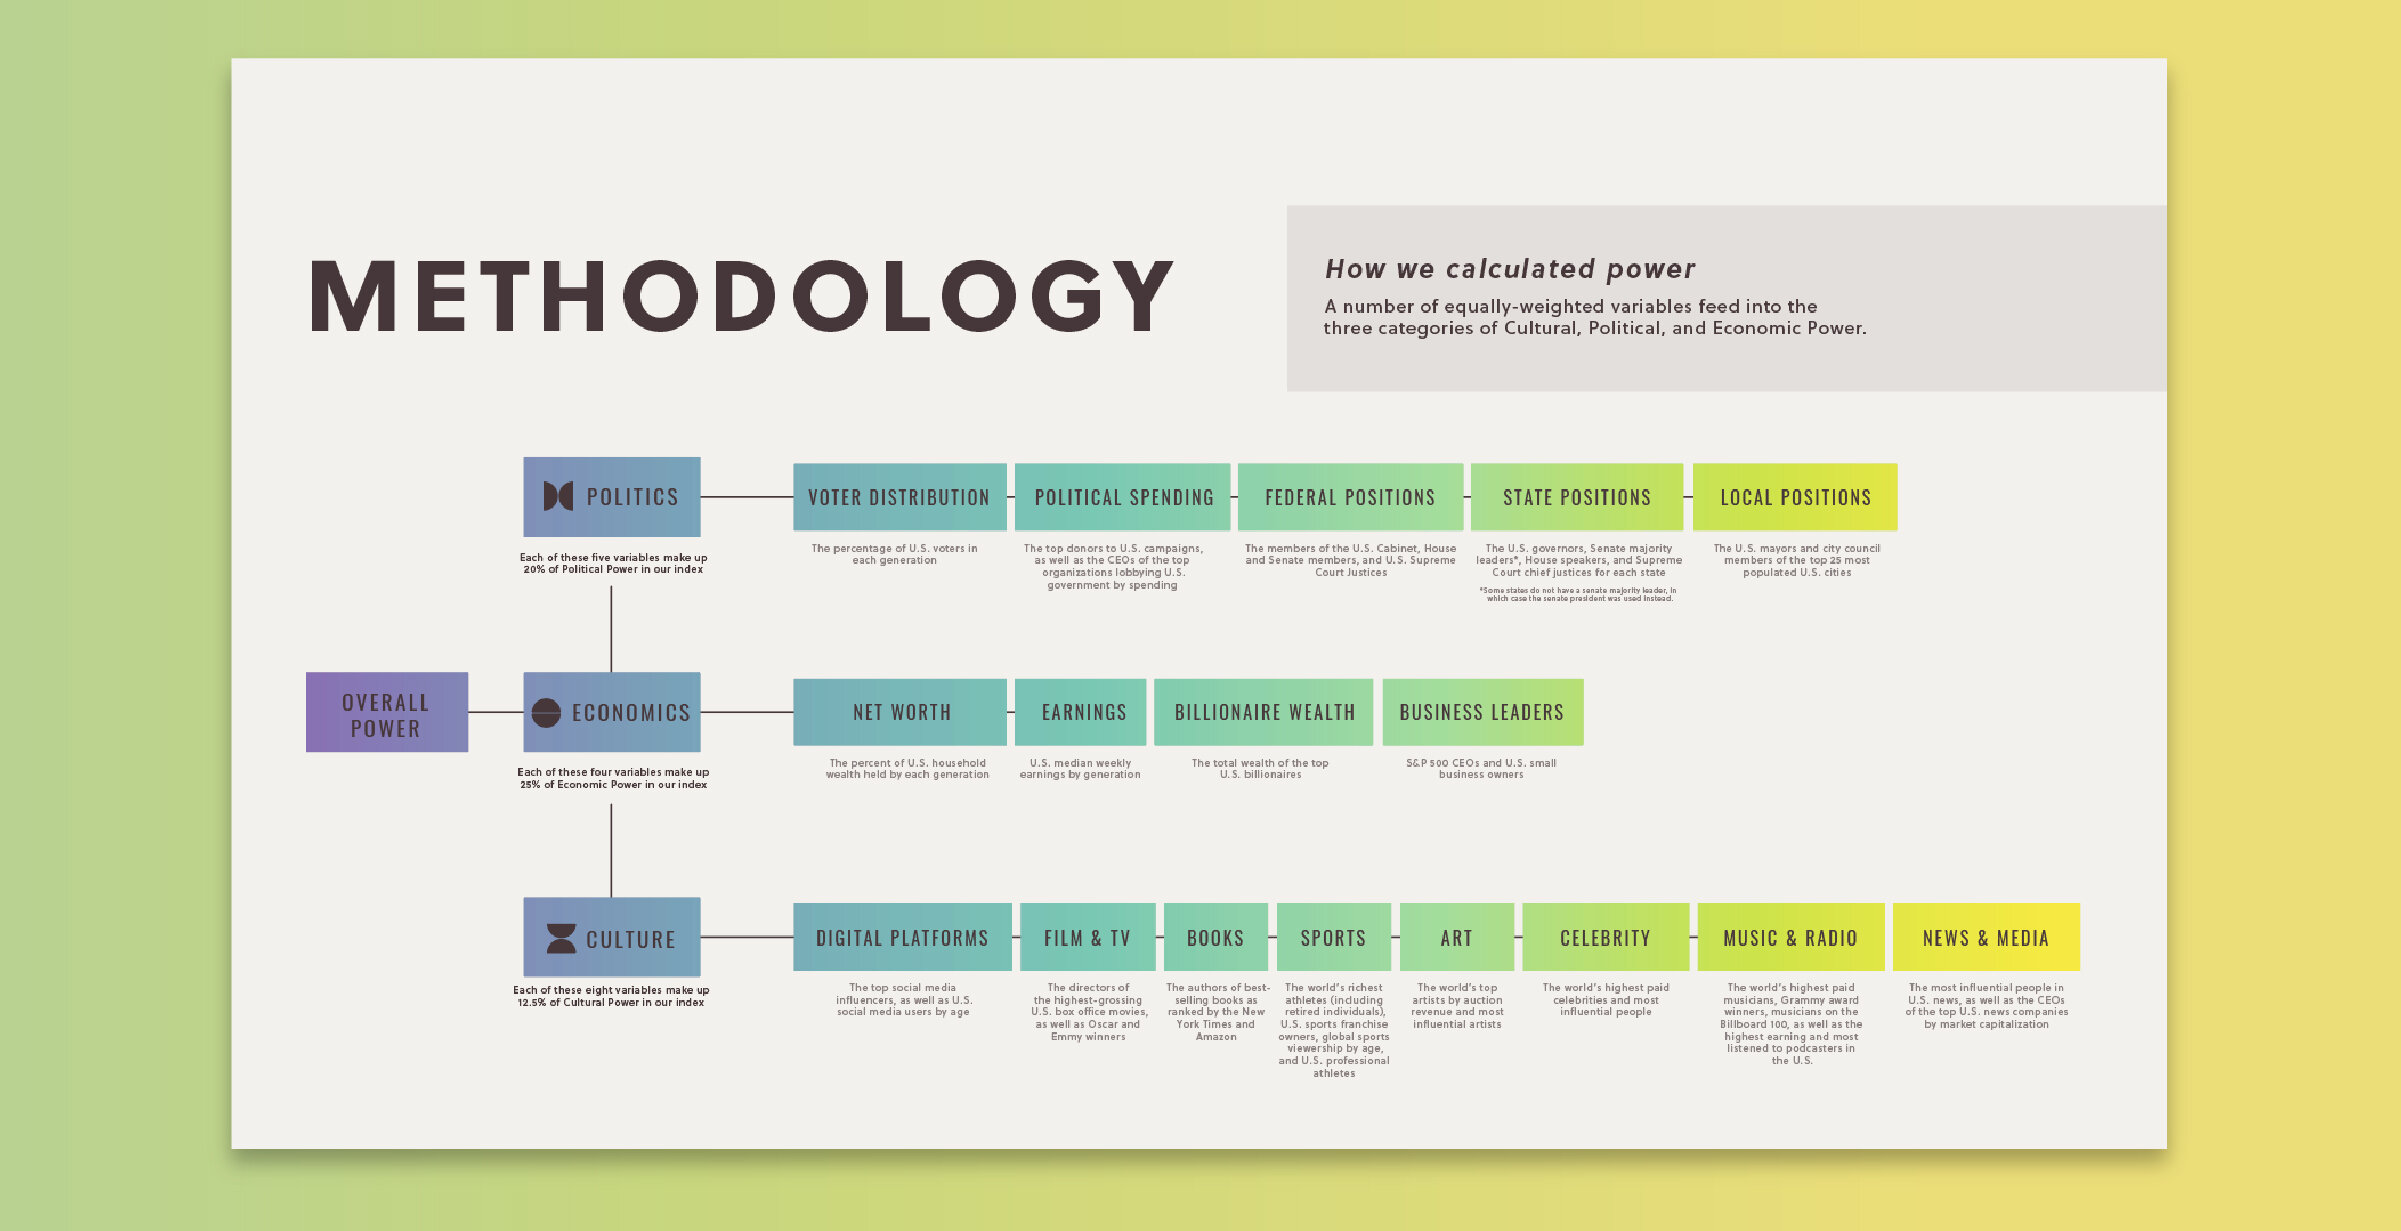
CONCEPT: Power and its changing faces. Our team explored a range of key ideas for the GPI: time, history, generation blocks, continuums, evolution, diversity, and—of course—data. In the end, we developed a geometric visual language for three main categories of power (economic power, political power, and cultural power), paired with photo collage illustrations that integrate with the conceptual bars of the data.
TIMELINE: 10 days
USE CASES: Report, content campaign, website, media pack

